

High-Trust Engineering Metrics
I once interviewed a professional oboe player for a software engineering job. One surprising thing I learned about the oboe is that top musicians spend several hours a day working on their instrument and only a few hours a day playing, which is the opposite of most instruments.
Building software is a lot like playing the oboe. Amateurs and casual observers only see the output (playing songs/implementing features) and aren’t aware of the tremendous investment in the health of the system (the instrument/processes, architecture and people) required to perform at the highest levels.
This iceberg-like nature of software engineering can cause tension and mistrust in organizations. Leaders sometimes push engineers to increase output at the expense of health because output is easier to see, while engineers are prone to overengineering things at the cost of business results.
DORA Metrics
This tension plays out in how organizations measure their engineering teams. One popular trend right now is using DORA metrics to gauge developer experience and team health. (DORA metrics are deployment frequency, lead time, change failure rate, and mean time to restore.) Researchers have found that better numbers correlate with higher performance.
However, business leaders are skeptical of these metrics because they do not directly translate into costs, which can lead to abuse. This can be frustrating for engineers who want more investment in team health, but justified given that developers are ultimately paid in dollars, not cycle time hours.
Cost Capitalization Metrics
Another trend in engineering metrics is cost capitalization reporting. This involves tying engineering time to tickets and bucketing it by type of work (e.g., roadmap projects, maintenance, etc.)
While cost capitalization metrics are business-friendly, they can lead to further pressure to increase output at the expense of team health. We have heard of engineers at companies rolling out Jellyfish threatening to not enter data to avoid this fate.
Engineering Business Metrics
The following chart further illustrates the landscape of engineering metrics. On one side, there are metrics that focus on output vs. team health. On the other, there are metrics that translate to business impact, while others are disconnected from money, making them easy to game and liable to become vanity metrics.
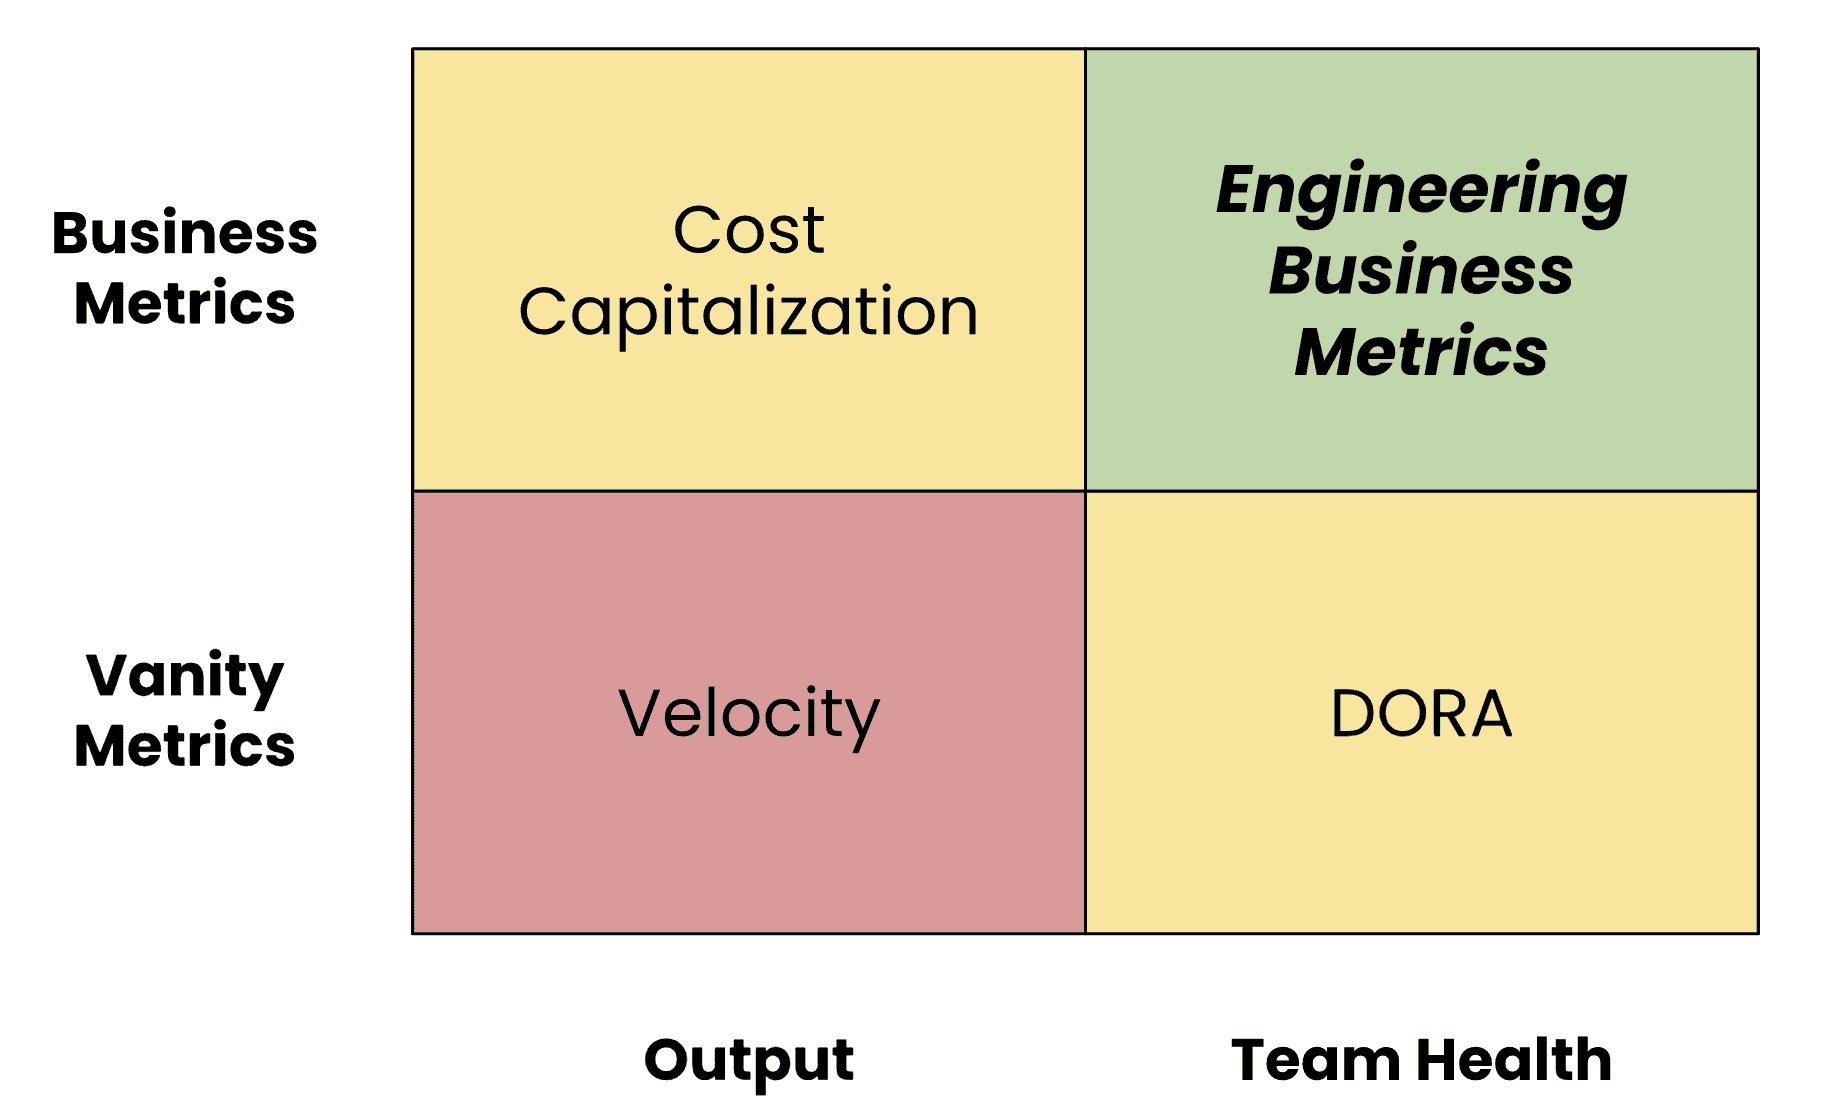
Business leaders and engineers generally agree that velocity is a bad metric, but there is disagreement from both sides about whether to move toward cost capitalization or DORA metrics.
However, it doesn’t have to be this way. The benefits of cost capitalization and DORA metrics are not mutually exclusive.
Engineering business metrics can bridge this divide by offering the best of both worlds. Measuring the monetary impact of things that affect team health allows everyone to make better decisions about investments in processes, architecture, and people that create deeper trust.
Getting Started with Engineering Business Metrics
Rolling out extensive engineering business metrics can be a lot of work, but getting started and adding metrics incrementally is easy.
This starts with recording how people spend their time on different activities. Then, you can separate team health activities (e.g., hiring, servicing technical debt, etc.) from customer-facing output activities.
Classifying time in this way shows the cost of investments in team health, and of inefficiencies caused by a lack thereof. More importantly though, it sidelines these costs from those of delivering features to customers, alleviating pressure to sacrifice health in the name of output.
Simple Example: Onboarding Cost
One important engineering business metric is onboarding cost. This measures the time it takes for new employees to ramp up to full productivity.
This cost should be recorded separately from the cost of projects that the new person is working on because it is an investment in their future.
Furthermore, breaking out onboarding costs highlights the potential benefit of better training, documentation, and developer tools.
An easy way to start measuring onboarding cost is to just ask teams how long it takes for a new person to get up to speed. Then, you can record 100% of their salary during that period as an onboarding expense. If you are doing cost capitalization reporting, you can simply reduce new employee salaries to zero during their onboarding period to avoid counting that time toward output.
More sophisticated methods for counting partial productivity can be added later, but this at least gives you a ballpark idea of how much the team is spending on new employee training.
Advanced Engineering Business Metrics
While some metrics like onboarding cost are straightforward to approximate, others require deeper analysis of data from multiple sources.
A system like minware can do the heavy lifting for you, linking commit activity, tickets, and calendar events to build an full time allocation model, which you can see in one view here:
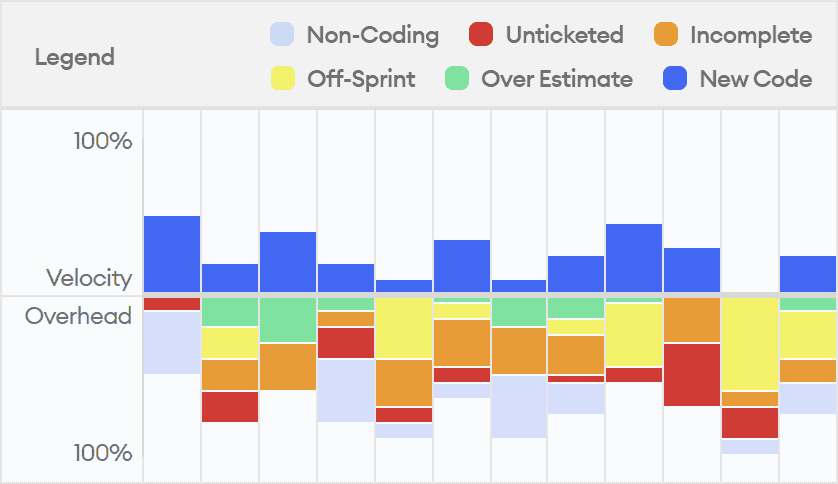
By recording how much time went into on each ticket (excluding meetings, time off, etc.), minware can compute metrics like time spent on tickets that didn’t wrap up by the end of the sprint, time on off-sprint or unticketed development, and time beyond the normal expected range for a ticket given its story point estimate.
These metrics track several potential team health issues. For example, estimate overruns are often caused by overly complex code associated with technical debt, while unticketed and off-sprint work may come from ad hoc requests or unplanned outages that interrupt the team.
These advanced metrics provide a more comprehensive view into how much teams suffer from velocity debt (technical debt, process issues, etc.) and the potential benefit of improvements in those areas.
The Bottom Line
The highest performing software teams invest heavily in systems, processes, and people, yet traditional software metrics like cost capitalization only look at output while ignoring team health, making them unpopular with engineers.
Newer metrics like DORA emphasize team health, but do not show business results, making them difficult for business leaders to trust.
Engineering business metrics bridge this gap by measuring the business impact of investments in team health, building greater trust between engineers and business leaders.
We shared a few tips here for getting started, but if you want to jump start your engineering business metrics, then we’d love to chat.