
Predictive Roadmap
Every other report in minware is backward looking. The predictive roadmap helps you plan for the future by seeing the impact of velocity on project completion dates and modeling different scenarios, while also showing historical timelines.
The predictive roadmap works by extrapolating story points or time estimates for tickets in epics (or simply epics themselves) using a configurable velocity parameter. Based on the velocity you specify, it will map out the timeline for future work, as seen in this screen shot:
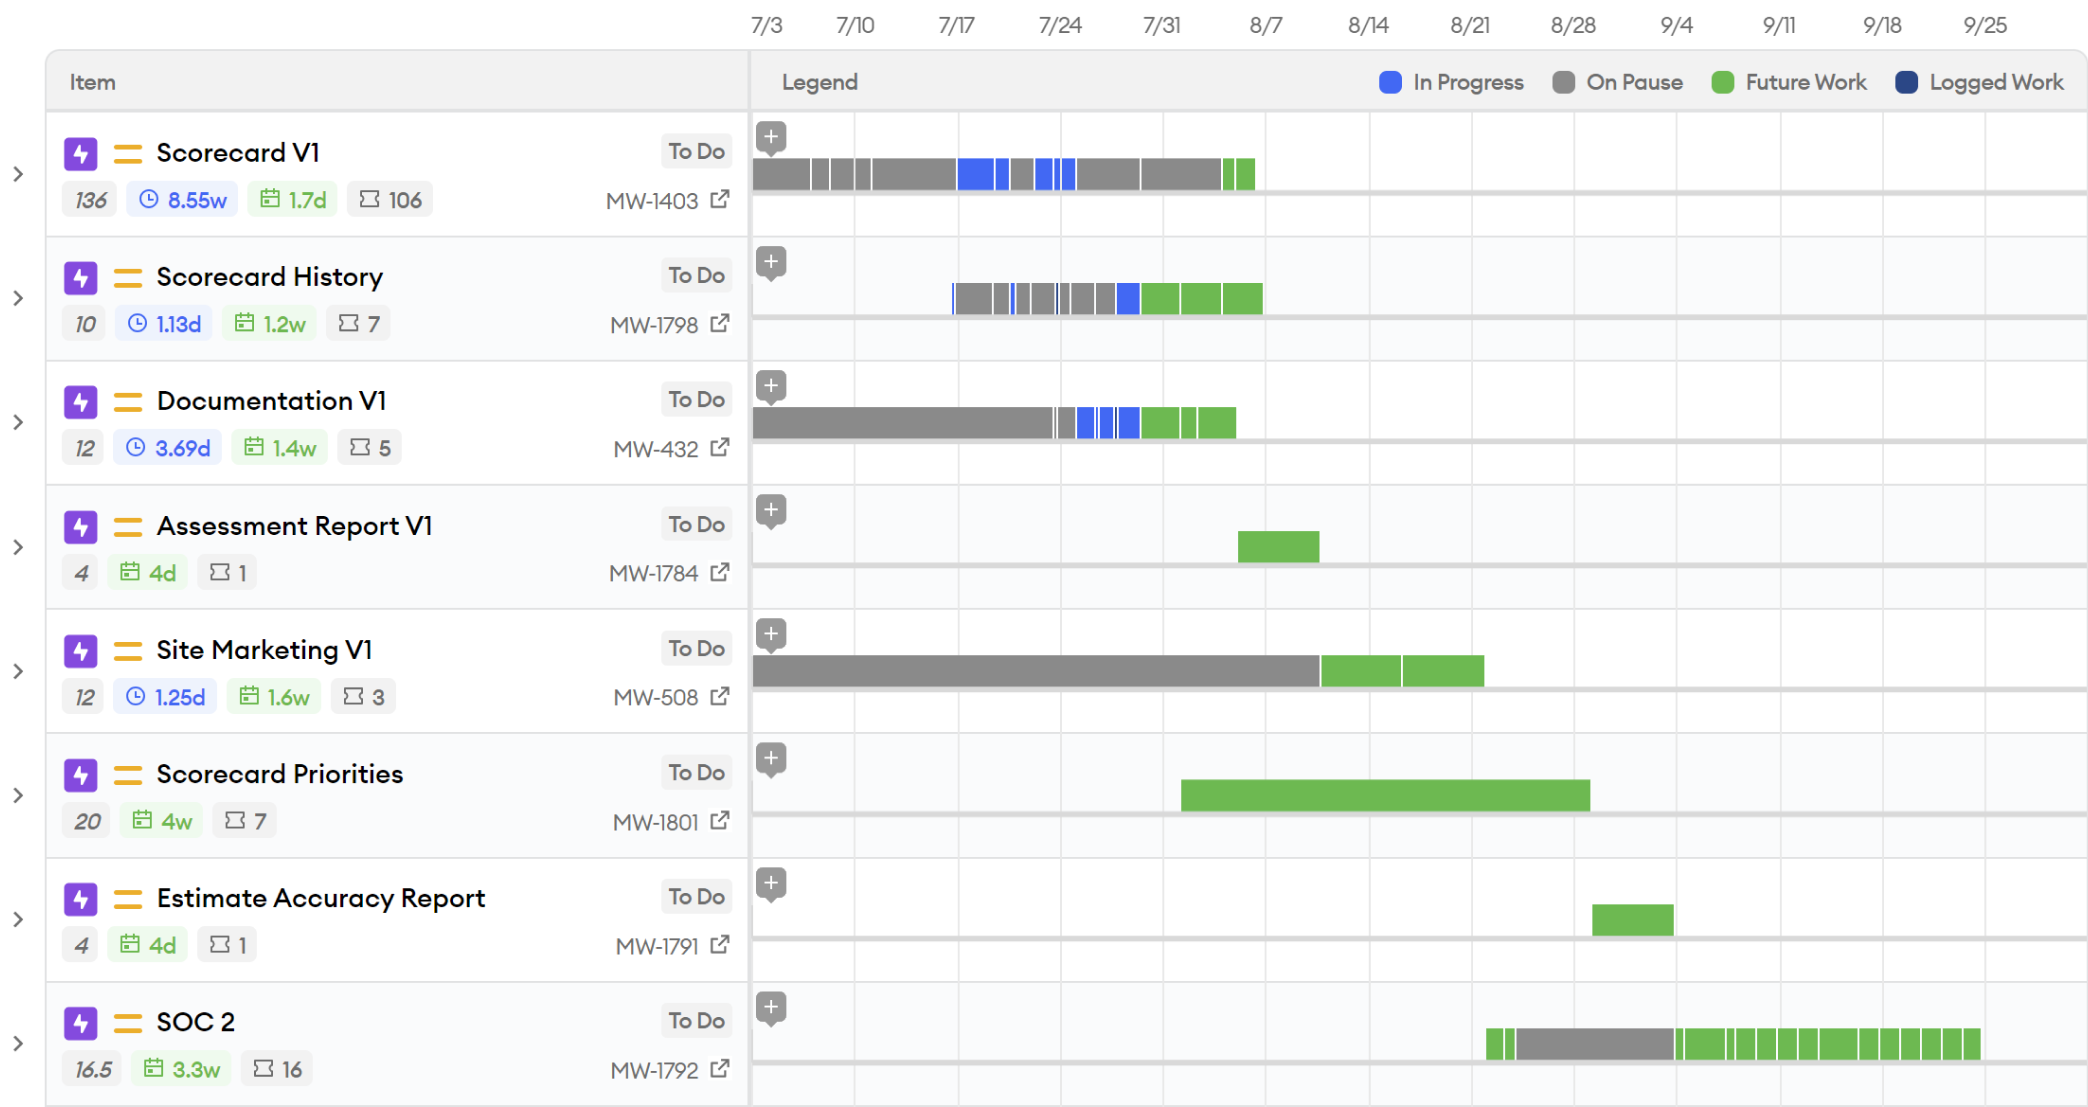
You can also expand the rows to see how specific tickets and subtasks line up in the timeline, both for future work and tickets that have already been finished as part of the epic.
Here the epics are ranked using the same order from Jira’s timeline view so that you can easily compare this report to any timelines established in Jira. The report also offers similar filters to Jira that let you narrow down the data by board, component, epic, assignee, etc.
Work Stream Grouping
One key feature of the predictive roadmap is that it lines up tickets in separate work streams based on the current assignee, with the assumption that different people will work in parallel but complete their own tasks one at a time.
This helps you easily visualize bottlenecks, like you can see in the gray area of the screen shot above. One person is free to start the project around 8/21, but the next assignee isn’t ready until 9/4 because they have other work that comes first. This shows that the work should be rearranged to avoid starting the project and having it sit idle.
You can also group the report by task assignee to see the current amount of work that is planned for each person. Unassigned work is given its own work stream grouping as if it were an additional person, which you can see in the screen shot here:
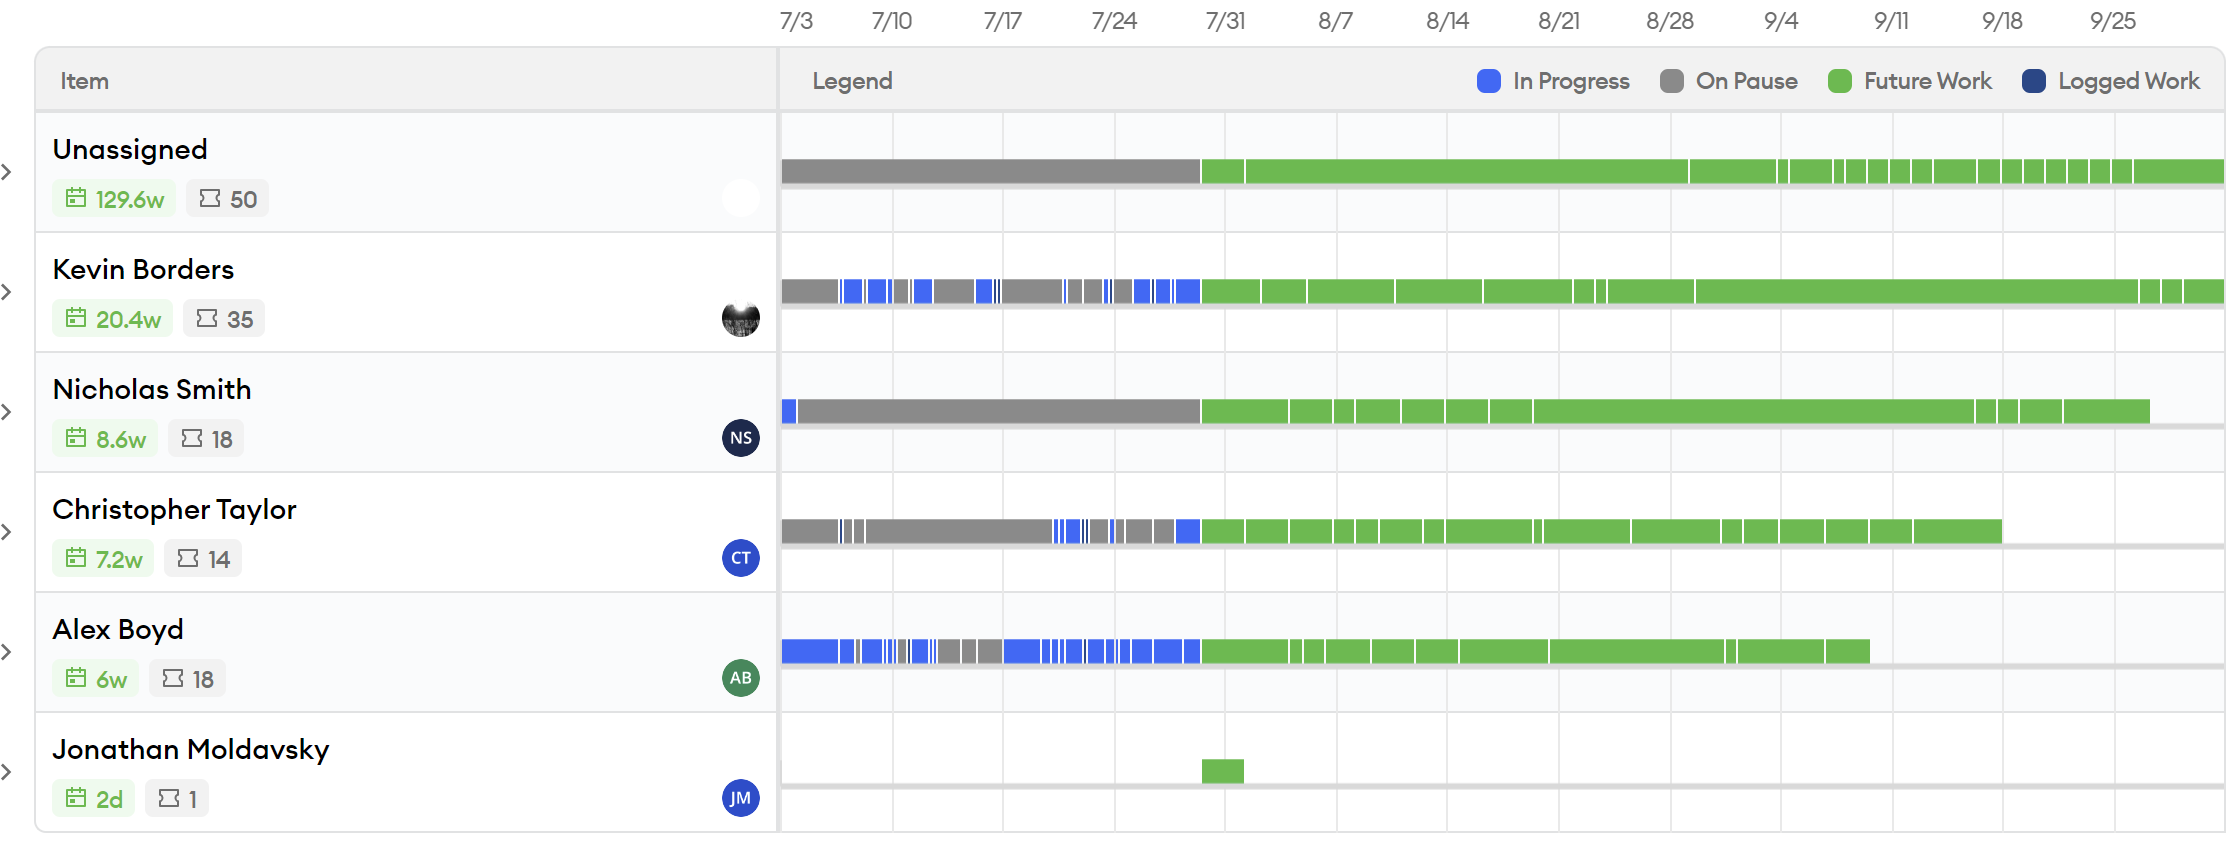
This view is helpful for seeing whether the workload is evenly balanced and how far out work has been assigned.
Modeling Velocity
One critical parameter for this report is the velocity in story points (or original time estimate days) per person per day. When you change the velocity parameter, the report will update based on the projected velocity.
Changing the velocity allows you to model different scenarios, which can be helpful for planning. Oftentimes, you want to make sure that certain projects will be completed by a certain date (such as a holiday or event) with very high confidence, but also plan what to do in the median scenario.
To model your team’s roadmap velocity, you should consider the following factors:
- Total Sprint Velocity - You can see how many points / person / day were completed in the Estimate Analysis section of your team’s most recent Sprint Insights report, as well as the historical average and trend.
- Unplanned Work Rate - Teams have to fix bugs and complete other unplanned tasks in addition to their roadmap work, which detracts from the roadmap velocity. (Bugs aren’t planned in advance, hopefully.) You can see the team’s non-bug load in Quality section of the Scorecard report and multiply that percentage by the total sprint velocity
- Scope Creep - Even if tickets are planned in a sprint, that doesn’t mean they existed in an epic when it started. To get a snapshot of your average scope creep, you can look at the Project Estimation metric under Predictable Projects in the Scorecard report. This is the percentage of epic work on tickets that existed at the start of an epic. Multiplying by this rate will pad the velocity to allow for unexpected new tickets in projects.
- Personnel Changes - Depending on whether people might leave or join the team, you can add a factor for personnel adjustments, which will be amortized over current team members.
Once you have these three numbers, you can multiply them together to get a total velocity. For example, if your velocity is 1 point / person / day, you have 80% non-bug load, 50% project estimation success, and don’t expect team changes, then the overall velocity would be 0.4 points / person / day.
Using historical averages is a good starting point to see the median scenario. Then, to model a more conservative outcome, you should think about what the lowest numbers might be for each of the four factors during the planned time frame and recompute a pessimistic velocity.
When to Use This Report
The predictive roadmap report is designed to support roadmap planning in an organization. As such, you can use it when building the roadmap during strategic planning (e.g., quarterly).
Additionally, it is helpful to check on the predictive roadmap at regular intervals during a strategic planning increment to see how work is progressing toward the original goals, and whether there have been changes to any of the factors that affect roadmap velocity.
Checking the report regularly (every few weeks) will ensure that your timeline remains up-to-date and you are able to identify any bottlenecks that may occur well in advance of when they materialize.
Who Should Use This Report
The primary user of this report is the person who is responsible for building the team’s roadmap, which may be a product manager or product owner.
Additionally, it is important for engineering leaders to provide estimates that feed into the roadmap, and also review the assumptions underlying the velocity scenarios to ensure that they agree with the team’s ability to hit their roadmap commitments.
Finally, the output of this report including different velocity scenarios can be shared with senior leaders in engineering product, and the broader organization, though we recommend this information be prepared by the primary user rather than having senior leaders directly use the report to provide explanation of the underlying assumptions and parameters.
How Not to Use This Report
While the predictive roadmap report displays information in a precise way with exact dates, the reality is that project delivery prediction is very fuzzy and subject to a lot of unknowns discussed above in the velocity section. It is important to keep these considerations in mind when looking at the report to avoid a false sense of certainty.
To this end, we recommend never looking at the report with a single velocity parameter and instead always looking at the worst case scenario in addition to the expected case you get from projecting current velocity.
Finally, when it comes time to look back and see how accurate the predictions were, you should keep in mind that inaccuracies are not inherently good or bad; each warrants its own investigation. For example, a project may have a lot of scope creep caused by new opportunities that arise allowing the project to create value far in excess of the scope creep’s cost.
The Bottom Line
The predictive roadmap is the final piece of the puzzle in minware’s mission to help teams deliver high-quality software on time. It builds on the best practices and productivity established by the other reports, empowering you to plan into the future with confidence.
This article is the last in our walkthrough series. Please contact us if you’d like to learn more – we’d love to hear from you!
