
Sprint Trends
After seeing how your team spends time with the time allocation report, the next layer that’s important to understand is how tickets flow through sprints.
The sprint trends report illustrates the flow of work by total estimate quantity. The estimate units can be either story points, original time estimates, or ticket count if there are no estimates (unestimated tickets will default to 1 story point).
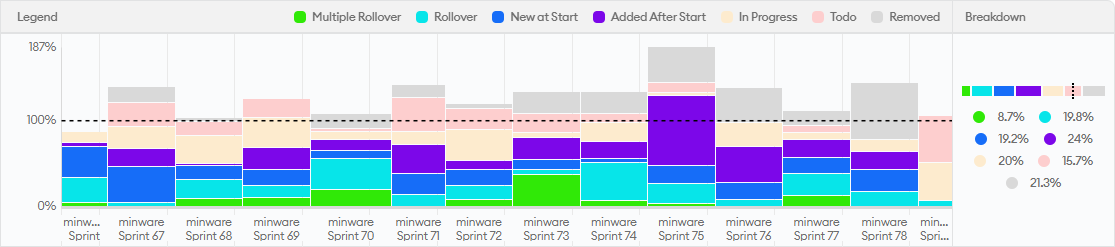
By default, the bar for each sprint is scaled relative to the total number of estimate units in the sprint when it started, which you can see with the dotted black line in this screen shot:
 |
|---|
| Figure 1. Sprint Trends report for team that comes in somewhat below sprint commitments and has somewhat high rollover. There is one sprint with a spike of work added after start. |
The report then breaks down estimate units into several categories. Overall, the solid green, teal, blue, and purple categories represent tickets completed in the sprint, while lighter yellow, red, and gray categories above represent incomplete work. The specific categories we identify here are:
- Rollover and Multiple Rollover - These buckets show completed tickets that were in one or more than one previous sprint, respectively, which helps visualize the degree of work that overflows sprints.
- New at Start - This is the ideal scenario where a ticket was in a sprint at the start and completed that sprint without being added to any previous sprints.
- Added After Start - This shows how much of the completed work was added to the sprint after it began
- In Progress and Todo - These buckets represent work that was not completed in the sprint, grouped by whether or not the tickets were in an in progress or todo status at the conclusion of the sprint.
- Removed - These tickets were manually removed from the sprint before it ended.
Note: This report will show a row for each scrum board in your organization. We are working on support for kanban boards in this report. If you’d like access to the beta version of Kanban trends, please contact us.
How to Read This Report
There are a few main things that you should look for when assessing the sprint trends report.
Low Overall Completion
The first and most important metric is overall estimate units completed relative to the commitment. The very best teams will regularly complete 80-120% of their commitment, meaning that they are able to accurately predict how much work they will get done.
The screen shot in Figure 1 shows consistent completion in the 60% range, which is still good, but could benefit from reducing the size of sprint commitments. What you don’t want to see is sub-40% completion, which indicates that the sprint commitment is essentially meaningless, as shown in the screen shot in Figure 2 below:
 |
|---|
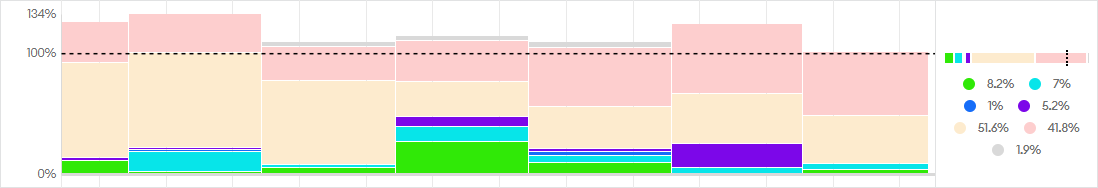
| Figure 2. Sprint Trends report for team that consistently completes far less than its planned sprint commitment (completed points in dark green, teal, blue purple colors). |
High Rollover
The next thing to assess is the portion of completed work that rolled over from previous sprints versus completed work that first showed up in the current sprint.
Here, your goals may depend on your team’s release process. For teams that do continuous deployment, some rollover may not be a big deal because those tasks can launch early in the following sprint. Rollover is a bigger problem for teams that release less frequently (e.g., if doing mobile app store releases) because missing the end of the sprint means waiting longer to release.
Regardless of your release process, however, multiple rollover is always bad because it means that tasks are taking longer than an entire sprint from start to finish, which breaks the idea of a sprint commitment.
Generally speaking, rollover ratios of less than 30% of completed work (single and multi-rollover) are healthy. The screen shot in Figure 1 is just above this mark and could benefit from breaking down tickets and reducing sprint scope to decrease rollover.
The screen shot in Figure 2 is way over with a majority of the completed work rolling over. What’s happening here is that most tickets are taking multiple sprints from start to finish, which you can further infer from the large amount of yellow “In Progress” work.
High Added After Start
While adding tickets to a sprint after it starts may not impact the team’s overall velocity, it means that the team is doing unplanned work and has less capacity for planned projects. This may be fine if the team is responsible for responding to a lot of time-sensitive issues, but it can also indicate lack of planning or inadequate testing that results in a lot of urgent bugs.
Generally speaking, if you see over 30% of work added after the start, it is worth digging into to understand the root cause.
In the Figure 1 screen shot, the one sprint with a big spike of work added after start coincides with a sprint where a large number of bugs were discovered and fixed. This may be okay if it is intermittent, but warrants investigation if it’s happening regularly, as seen in the screen shot below in Figure 3 (even though the team’s velocity exceeds the overall commitment):
 |
|---|
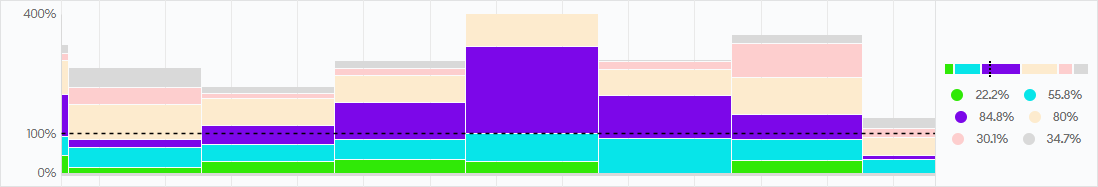
| Figure 3. Sprint Trends report for team that meets point commitments but has a large amount of work added after the start of the sprint (in purple). |
Not Removing Tickets
It is a general best practice to remove things from the sprint as soon as it’s clear they will not complete by the end. This makes it easier for stakeholders to know what to expect. To assess this, compare the amount of light red work (tickets that did not start and were not removed from the sprint) to light gray to see whether removals are happening on a regular basis.
The Figure 1 screen shot above shows good removal practices in the later part of the chart, whereas the Figure 2 screen shot above has hardly any removals.
When to Use This Report
Because the sprint trends report provides a high-level overview of sprint completion, we recommend reviewing it on a strategic cadence, like the time allocation report.
This means reviewing it at the start of planning intervals (e.g., quarterly) to set priorities, and then reviewing it at the end of each sprint while there are specific ongoing initiatives to improve the results.
Who Should Use This Report
Senior leaders should review this report to gain a base understanding of where each team is at in terms of process maturity. This allows them to know which teams need the most help and better understand challenges they face, such as high rollover being caused by slow QA processes or high tickets added after start resulting in too many urgent requests coming from outside the team.
Individual team managers, scrum masters, and product owners may also find this report helpful to review at the end of each sprint to see how their progress is trending over time, though the Sprint Insights report provides more ticket-level detail and a burndown chart that is more appropriate for sprint retrospectives.
How Not to Use This Report
While it is generally good to meet sprint commitments for the sake of predictability, be very careful about putting too much emphasis on exact sprint completion. The obvious reason for this is that when performance reviews are on the line, it is easy for teams to just put way less stuff in the sprint than they can complete so that they will never miss a commitment, effectively completing less work overall just to smooth out the numbers.
It is also very important for senior managers to solicit context from people on the team before drawing any conclusions about the numbers. While there are some things largely under the team’s control like task size and estimate accuracy, more often than not the underlying cause of sprint problems lies outside the team, such as changing or ambiguous business requirements, external dependencies, technical debt, or slow QA/deployment processes. When viewing this report, the default stance for managers should be: What help does the team need from me to have a healthier process?
The Bottom Line
Sprint trends provides a high-level overview of how tickets flow through sprints in a scrum process, helping visualize bottlenecks and issues on each team. This report is great for seeing long-term trends, informing strategic priorities, and tracking improvements related to sprint task flow.
Here are cases where other minware reports may provide more relevant insights than the sprint trends report:
- Time Allocation - The sprint trends report can only see tickets in a sprint, but doesn’t show all the other under-the-radar activity that happens on each team. The Time Allocation report provides a view into time that goes into each sprint.
- Predictive Roadmap - While a predictable flow of completed tickets is necessary for overall success, it is not sufficient because it does not capture things like scope creep (when scope creep issues are planned in the sprint). The Predictive Roadmap shows how tasks completed in each sprint feed into predictable project completion.
- Sprint Insights - The sprint insights report shows aggregate trends, but is not the best way to visualize the flow of tickets inside of a particular sprint. The Sprint Insights report shows a detailed burndown and is more appropriate for a sprint retrospective.
- Scorecard- Spotting issues in the sprint trends report kind of requires eyeballing it or scrutinizing numbers individually, which can be hard if the issues are not large and obvious. The Scorecard report applies specific thresholds to flag each issue that can arise with sprint processes, so is a better way to gather insights about specific improvements you should make on each team.
If you’re following the walkthrough series, we recommend reading about the Scorecard report next.
