
Time Allocation
The first thing to look at if you’re new to minware is the time allocation report. This report shows you how much time engineers have available for planned tasks. Having ample productive work time is a necessary precursor for downstream sprint completion and project delivery, so it is the first place you should look to better understand your efficiency.
Capitalization View
This first screen shot shows what the report's main chart will look like when you load it for the first time:
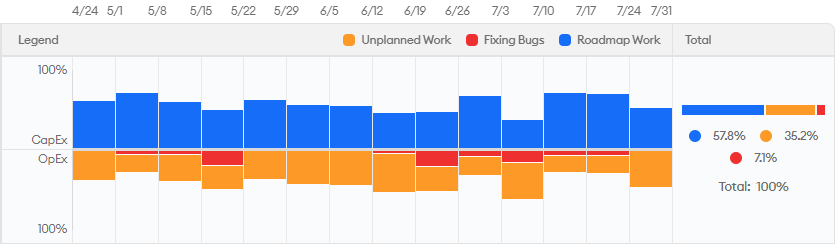
In this view, the report is grouped by Capitalization, which is the approach that other cost capitalization solutions take to allocating time.
With Capitalization, minware allocates as much time as possible to roadmap work, including time that was used inefficiently. This is typically what you want to see from a finance perspective where the goal is to capitalize as much as possible without worrying about productivity.
Velocity View
The following screen shot shows a more detailed breakdown of how people spend their time based on its contribution to Velocity:
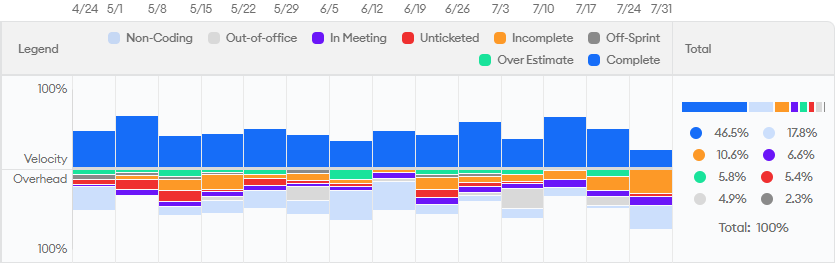
This chart shows less good time above the line in blue because it only counts activity that flowed successfully through proper agile processes. It tells the real story that leaders in engineering need to debug productivity problems.
While the Capitalization view only deducts time spent on non-capitalizable tasks, the Velocity view further excludes other common detractors from predictable delivery:
- Non-coding Time, Meetings - Developers can’t (and shouldn’t) code all day long, but excessive meetings or non-coding time can highlight problems with training, overhead, or blocking dependencies.
- Unticketed, Off-Sprint Time - These metrics show how much time is untraceable due to improper code/ticket hygiene, or is “off the books” because it was never added to a sprint. Either way, it’s important for healthy scrum processes that nearly all work be ticketed in the sprint to provide basic visibility
- Incomplete Time - Time spent on tasks that didn’t wrap up as planned by the end of the sprint.
- Over Estimate Time - Time spent beyond what is typical for a task of a given estimate, which can indicate a variety of problems including tech debt, poor requirements, overly large tasks, etc.
How Is the Data Calculated?
This report relies on minware’s patent-pending time model. First, minware automatically calculates which hours of the day and days of the week each person is active to create a schedule for each person. We then allocate five work days per week to those active time periods for each person, which we call “dev days.”
Next, we look at the commit history and attribute time between commits (scaled from wall clock time to dev days using the method described above) to the commit that follows. So, if you regularly work 9-5 Monday-Friday and commit at 1 PM and at 5 PM on a given day, then the 5 PM commit will have 0.5 dev days allocated to it, which will then roll up to any ticket associated with the commit’s branch, and from there to any epic or sprint.
The time model also caps the time allocated to any single commit at one dev day, with the assumption that people commit at the end of each day. Going back to the previous example, if someone commits at 5 PM on Monday, and then commits next at 5 PM on Wednesday (two days later), then the Wednesday commit will have one dev day, and the one dev day of time on Tuesday will be recorded as non-coding time (or in-meeting for times during meetings).
Note: minware properly handles squashes, rebases, and delayed pushes, so we will see any commits that the server (e.g., GitHub) eventually sees and factor those into the time model. If you believe that people in your organization do not regularly commit every day, or they squash/rebase commits locally without ever pushing them to the server, then please talk to us about configuring minware to fit your work patterns.
How to Read This Report
The time allocation report helps you see bigger trends in productive time dedicated to ticket completion. When looking at this report, there are a few types of insights it can provide.
First, do the total allocation rates (seen in the right column) reflect your overall goals and expectations? If not, you can expand the main row to see how the numbers differ between ticket types, projects and people. You can also use the grouping drop-down in the upper left corner and filters in the upper-right corner to see overall differences between teams, projects, and people.
Next, you should look at the main chart to see if there are intermittent bursts of non-productive time. You can then expand the main row to see which projects or ticket types are associated with that activity, which may be related to changes in team membership/onboarding or particular projects. Again, you can break this down using the grouping and filters.
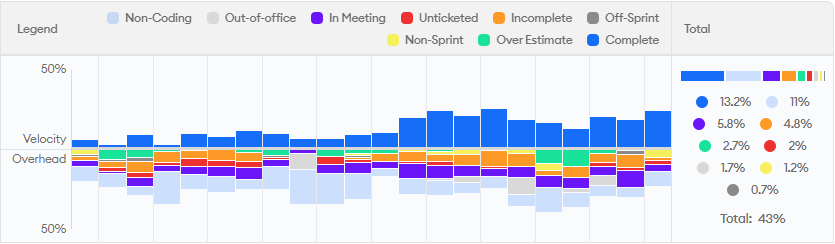
Finally, this report helps you see whether you’re headed in the right direction. Major changes can show up in a matter of weeks, but you may also want to expand the report to longer time ranges (e.g., 1 year) to see long-term trends. Here’s a more dramatic example from one of our customers where major changes quadrupled productive time over a three-month period!
When to Use This Report
Because this report is higher-level, we recommend looking at it with a strategic cadence. This means using it at the start of each planning period (e.g., a quarter) to prioritize improvements that will have the greatest impact.
It is further helpful to review the report regularly (every two weeks or every sprint) while specific initiatives like reducing off-sprint work are in progress to see whether they are on track and yielding the expected results.
Who Should Use This Report
We recommend that senior leaders understand what’s in this report at the organization-wide level. This will help them make better decisions about how much effort should go into improving the results, and where teams need the most support.
Once overall strategic objectives are in place for the organization, we recommend that teams and individuals view their own data to see the impact of their actions each sprint. It is incredibly rewarding for people to be able to visualize their progress on a chart and celebrate their success with others.
How Not to Use This Report
As with any metric, asking people to blindly optimize their time allocation – whether explicitly or implicitly by tying it to performance reviews – can have significant risks. It is important for managers to avoid judging the numbers at an individual or team level without understanding context.
There are certain buckets of time – like unticketed or off-sprint time – where it could make sense to tell people to just drive it to zero. In essence, the risk of people “gaming” these metrics is low because the easiest way to improve them is to always link branches to tickets and put tickets in sprints.
If you look at meeting or non-coding time metrics, however, some of this time is still important, but it’s difficult to tell what is necessary from looking at this report alone. While it’s helpful to make sure the overhead from these activities is in line with expectations, putting too much emphasis on reducing them could lead to people avoiding critical non-development work like coaching, planning, and talking to customers.
The ticket-related metrics like incomplete and over estimate time are generally good to reduce, but not if it means avoiding challenging tasks or sacrificing quality. We have unfortunately seen people merge code in a broken state just to mark it as done and meet their sprint goals. So, it may be beneficial for leaders to set goals related to task completion and estimate accuracy, but they should assess results holistically and not use time allocation alone as a target.
The Bottom Line
Time allocation is a good first glance into where time goes in your organization and high-level activities that detract from velocity. This report is helpful for strategic planning and observing the impact of larger initiatives.
However, there are scenarios where other minware reports are more appropriate:
- Sprint Trends and Predictive Roadmap - The time allocation report only looks at time available to work on sprint and roadmap tasks, but does not look at higher-level predictability. The Sprint Trends and Predictive Roadmap reports provide a deeper view into efficiency at the ticket and project level.
- Sprint Insights - The time allocation report is designed for observing longer-term trends and aggregates all data by week. The Sprint Insights report provides a lot more detail with specific commit timelines and has more information for teams to drill into details during a sprint retrospective.
- Scorecard - While the time allocation report is great for visualizing high-level trends, it is more of a lagging indicator and does not provide specific guidance about what to improve. The Scorecard report provides a more detailed to-do list of actionable improvements that will drive up time allocated to productive work.
If you’re following the walkthrough series, we recommend reading about the Sprint Trends report next.
